What’s happening to America’s middle class: The numbers behind one of the country’s key trends
What is happening to America’s middle class? People from across the political spectrum use a lot of different words to answer that question: “Hollowed out … wiped out … disappearing … declining … doesn’t exist anymore.”
OK, but what’s really happening to the middle class? What do the numbers say? On this episode of Numbers Geek, we answer that question with insights from former Microsoft CEO Steve Ballmer and his civic data initiative USAFacts. Listen below, or subscribe in your favorite podcast app, and continue reading for an edited transcript.
To understand what’s happening to America’s middle class, the first thing you need to do is define the middle class. That was the challenge for former Microsoft CEO Steve Ballmer and his team at USAFacts. That’s the not-for-profit, non-partisan, civic data initiative that’s GeekWire’s partner on the Numbers Geek Podcast.
Steve Ballmer: It’s funny. People talk about the middle class and there’s no formal definition. And when people say the hollowing out of the middle class I don’t really know what they mean.
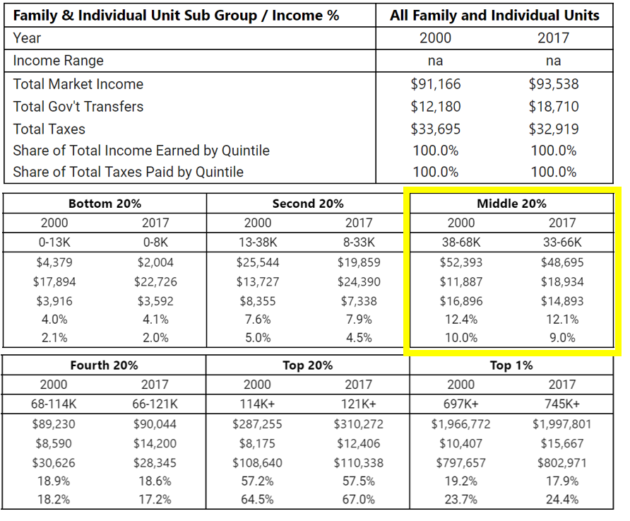
Todd Bishop: So they looked at households in the United States and specifically at household income. And then they divided those households up into what statisticians call quintiles. Think of it like a five-layer cake, with each layer containing a different 20% of American households, stacked in order of household income. The middle layer, the middle 20%, that is what they studied.
Steve Ballmer: So rather than try to deal with a loosely defined thing from a numeric standpoint we just said, “Hey, what does life look like for the people whose income is literally in that middle 20%.” That is our middle class.
Todd Bishop: So here’s what they saw when they did that. In 2000, when adjusted for inflation, the range of household incomes in that middle 20% started at $38,000 a year. By 2017, 17 years later that had slipped from $38,000 a year to $33,000 a year. Now at the high end of the range household income for that middle 20% fell from about $68,000 a year in 2000 to $66,000 a year in 2017. So the entire range of incomes in that middle 20% slipped. Which of course is never a good thing, whether you’re talking about a cake or an economics quintile.
Steve Ballmer: That to me says the middle class is being hollowed out, because the less affluent are getting less affluent. The poor are getting poorer and the rich are getting richer. And my way of seeing that is to see how much more spread there is now in that middle 20% of earners, the spread in their incomes.
We studied it in a lot of different ways. We looked at people who are single without kids, because their economics are a little different than people who are single with kids. A little different than people who are married with children, without children, seniors. And when you look at it, wage income across all those groups, except for seniors. We just have a higher percentage of seniors working. They are all down.
Todd Bishop V/O: As one example, in that middle 20%, households with a married couple and kids under 18 saw their market income — things like wages and retirement and dividends — decline from more than 54,000 to less than 51,000. That was between 2000 and 2017 when adjusted for inflation. But here’s what’s really interesting. When you take into account what they call government transfers, things like tax credits and Medicaid, the income of those families is actually up from $64,000 to more than $78,000 over that same time period. And that overall trend is also true for the middle 20% as a whole.
Steve Ballmer: If you look at the total amount of money that people have, if you will, to take care of themselves it’s up. But a big part of that is transfers from government. Whether that is Medicaid, whether that is the earned income tax credit. Those things are essentially holding the buying power of the middle class to be flatter up, inflation adjusted. But market income is coming down. Which presents a deficit problem.
We’re not talking about the poorest people in this country. We’re talking about the middle 20%. And yet that is what the middle 20% looks like in the country. And government’s having to put in significant subsidy, not just for our poorest people, but for our middle class people.
Todd Bishop: You can start to see how all of this is connected. If wages are down and then there are more government transfers, increasing buying power, that can help the GDP. It can help the economy overall. And yet it can also contribute to that annual deficit, which adds to the debt. And then you get the trade deficit that comes into play here because people are buying cheaper overseas goods. It’s fascinating. And then that has been one of my key takeaways, doing this project. You tend to think of healthcare as one thing, and immigration as another, and the economy as another. But it is all connected and you start to see it when you look at those numbers.

Steve Ballmer: Right. You do. And then the question is how are we going to pay for these things that we’re doing. Are we going to borrow I’ll say from our children, who will have to pay this in their taxes? Or are we going to increase taxation? Or are we going to tell people, “Hey look, the jobs that are being generated today just aren’t generating the kind of income that people might want to have.”
Now one other thing I will say: this is an environment where the taxes that the middle income people pay are actually, by and large, down. So if you do all of this math net of taxes things won’t look quite as bad in terms of lifestyle for people in middle income brackets. It will look even better. On the other hand it means the deficit’s going to be bigger because tax revenue is down inflation adjusted from the middle 20%.
Todd Bishop: Another big trend that’s singled out is the fact that family structure is changing. More people are living alone. More married couples are not having kids. How is that impacting the economy and the whole framework that we’re talking about here?
Steve Ballmer: Well, when you look at thing, the fastest two growing parts of the population are people over 65 who earn less income and depend more on social security and Medicare, and single people actually without children. Single people without children actually account for 43% of all of the households in America. 43%. That was so non-intuitive to me. I think about families with kids. I think about single moms. I think about seniors. And you know, yeah, I think there are people right out of college, you know they do live. They live in these households. But not 43%. That surprised me. That would include of course not just younger people right out of school, but also older people.
Steve Ballmer: In fact, the average age of people, these 43% of people who live single is almost 40 years old.
Todd Bishop: And it’s important to point out here, we are talking about the slice of the population that is in the middle 20% of median household income. The stats you just gave are not for the population as a whole.
Steve Ballmer: You’re right. Correct. Just for the middle 20%. But we have a lot of people living alone, they’re under 65 years old. And it’s interesting.
Todd Bishop: But there is another interesting way to look at the middle class: Median US household income. That number was 61,372 in 2017, which was a 1.8% increase from the 2016 median household income, when adjusted for inflation.
Steve Ballmer: The median household income is a reflection of what a household buying power is. Can you afford a home, or can you afford rent. Can you afford food. What can your cell phone be. How much do you have for education.
Todd Bishop: As we discovered though, not many people can come even close to guessing this number.
Person on the Street #1: Median income, I would say is 70,000.
Person on the Street #2: My guess, it would be around 30,000. I think that’s pretty low for what it takes to live.
Person on the Street #3: I have no idea. I feel … I don’t know. For some reason I think something higher. I’m going to say $40,000 a year.
Person on the Street #4: $58,000.
Person on the Street #5: I was going to say 50.
Todd Bishop: What did you think of those answers?
Steve Ballmer: I was surprised how low people guessed the number was. Given the dialogue in the press I might have guessed that people would pick a higher number. So it did surprise me in many ways. Particularly if you think on just how hard it is to live say on $30,000 a year. That’s very difficult to do in the United States. Part of it is people may not think about the value they get out of various insurance and other benefits that they receive either from the government or not that help them live. But I was nonetheless surprised.
Todd Bishop V/O: And news coverage of this topic often raises as many questions as it answer.
Todd Bishop: So here is the story from the New York Times with the new number. US Household Income Rises to Pre-recession Levels, Prompting Cheers and Questions. More adjectives and adverbs in this story. The income of the median American household has finally rebounded from the damage caused by the 2008 financial crisis, a significant milestone in the nation’s painfully slow economic recovery. Median household income rose to 61,372 in 2017, and that is up from the prior year.
What do you take away from that increase?
Steve Ballmer: Well, first thing I’d ask is, is it inflation adjusted? Have the numbers for 2016 been adjusted for inflation? If they’re adjusted for inflation then we might have a 1.8% increase in really what the median buys. And if they’re not adjusted for inflation, you know you can ask what was the inflation number, and it’s possible you can buy less this year than last. But it just says median income. I don’t know whether to assume it’s inflation adjusted or not. I hope it is. And I actually know that it is because I know the census bureau numbers. On the other hand the New York Times probably should have called that out. Otherwise they’re not being clear about what the numbers are.
Todd Bishop: So here we actually have the US Census Bureau numbers, and they show that the median income rose-
Steve Ballmer: Increased in inflation-adjusted so called real terms from 60,309 to 61,372, which really does mean that even adjusting for inflation people will have about $1,000 … The median person, assuming there is one, median household, will have about $1,000 more to spend in 2017 than they did in 2017.
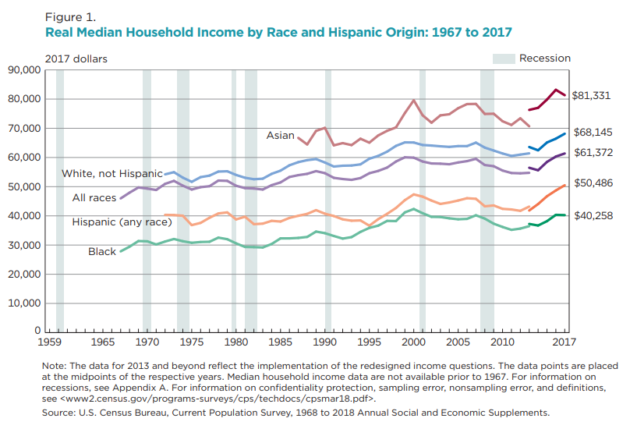
Todd Bishop V/O: Another big wrinkle in this conversation is race. While predominantly white households have seen their median income rise to more than $68,000 a year as of 2017, the US Census Bureau reports median income of a little more than $40,000 for predominantly black households.
Steve Ballmer: People can be disadvantaged for a lot of reasons. But race and ethnicity are one factor. Because you do see absolutely that there’s a higher poverty rate, lower median income, for blacks and Hispanics, than there would be for whites or Asian. But you can certainly have issues of economic mobility, kids being able to have a shot better than their parents, to move up economically. You can see that in black kids, Hispanic kids, white kids, and Asian kids in fact.
The chart is alarming to me when I see that median household income for African Americans is $40,258. And has been relatively flat since the year 2000. And the median income for whites is $68,145 and that number is up some since the year 2000. I look at that and say, “Wow. That doesn’t seem right. African Americans have not benefited in the same way as whites have.”
Todd Bishop V/O: Longtime Numbers Geek listeners may recall that this is the same chart we talked about with Arlan Hamilton of Backstage Capital, the formerly homeless venture capitalist who’s on a mission to fund companies led by minorities and women of color.

Arlan Hamilton: I think that you’re talking about institutional systemic things. In some ways black and brown folks are set up to lose. We were … I mean we can get raw right now. We were brought here, black people were brought here as slaves to be animals to go from A to B, A to Z, whatever. When that didn’t work out for people they found other ways, like prisons and other ways to keep us enslaved. And while we have evolved so much over the past few decades, and we have. The way that I grew up is very different than the way my mom grew up, and the way that she grew up was very different than the way her mom grew up. While that is true, we were just not supposed to win. So that is why you have to in this country be Oprah Winfrey to be considered a success. You have to be one of the richest people in the country. You have to go against all odds. I personally have to have had the story of being homeless to venture capitalist investing in a 100 people, to even have a chance to be on the radar of the American conscious, as someone to be taken seriously in business.
Todd Bishop V/O: The upcoming 2019 USAFacts annual report on the US government has more stats on the differences in earnings by family structure, race, and gender.
Todd Bishop: I know you talk with policy makers, legislators. Do you feel they have a grasp on the changing demographics, the changing income structure of American households at this level?
Steve Ballmer: Do I think most policy makers see the nuance and look at these things comprehensively? I would say no. I’m afraid most policymakers report what they read on the internet or saw in a newspaper, which would generally tend to be one number without context.
Todd Bishop: What does it say about the American dream? Whether the median household income is rising, whether the buying power is increasing. How does this factor into the ability to achieve the American dream?
Steve Ballmer: The American dream is probably two things. Number one is am I better off than my parents. Well, part of that is is the economy better off than it was when my parents were my age. And that’s an aspect. The other part of the American dream is can I really dream to be anything I want to be, no matter where I’m born. And those are a little different dreams. And median household income talks more to the first one. How’s my life compared to my parents at this age. At least from an income perspective people’s lifestyles have been relatively stagnant.
Todd Bishop V/O: Here’s how venture capitalist Nick Hanauer put this at a GeekWire event last year.

Nick Hanauer: Over the last 40 years an incremental two to three trillion dollars per year is flowing to the top one percent of earners, that used to flow to ordinary Americans. If the median family had fully participated in productivity growth over the last 30 or 40 years they would earn over $100,000 a year. What that means effectively is that the country owes the median family a raise of between 25 and $40,000 a year.
Todd Bishop V/O: Nick Hanauer was an early investor in Amazon, who’s now an activist on issues including income inequality. And he has his own podcast called Pitchfork Economics.
Todd Bishop: What are the key facts that you would want people to focus on that would help everyone understand what’s happening to jobs, wages, and ultimately to American families?
Steve Ballmer: I’d say a few things. A higher percentage of people are working today than in the past. The way they are living together has changed. So you have fewer two-income families today than you did. So the way households have income to spend is different. The jobs that people have today are different than the jobs people have 16 or 17 years ago. And many of the jobs that have been growing most quickly pay less actually, although some jobs like finance and tech, and some of the high-end of the medical … The medical technician field is growing and they pay pretty well. So what jobs exist change. How people live who make money change. The percentage of people who are working has changed. Where people spend their money, how much money they make in their jobs has changed. How much money households have to buy things have changed. And the mix of things that they do buy has changed. And in a sense you want to look at that if you really want to know how Americans are doing, you want to factor in a number of those things.
And probably the best way to put it all together is say how does the average family with kids live? How does the average person who is elderly live? So when people say the middle class is hollowed out, you can look at it just by the numbers at a gross level. You can take a look at what it means if you are single without kids, etc., etc. So as we’ve been talking about, there are various ways that are important to take a grab if you’re really going to ask the question what is the buying power, how is that changing for not just America somehow as a whole, but America as America chooses to live. Because the way people choose to live together is very different today than it was in 1980.
Todd Bishop: Is there a way to boil it down and say are we better or worse off than we were in the past?
Steve Ballmer: That would be a judgment of whether we’re better or worse off. And I think it’s important for us at USAFacts not to make judgments. But we pull this information together in a way that people can draw their own conclusions, look at our annual report at usafacts.org, or really look at the source information that we’ve been talking about today.
Todd Bishop V/O: So now as we approach the 2020 presidential campaign hopefully you have a better sense for the numbers to think about when politicians talk about what’s happening to the middle class. And of course you can check out interactive graphics, charts, and more about the data we talk about on the show at usafacts.org.
Clare McGrane contributed research, reporting, and production assistance.
Conclusion: So above is the What’s happening to America’s middle class: The numbers behind one of the country’s key trends article. Hopefully with this article you can help you in life, always follow and read our good articles on the website: Ngoinhanho101.com

